If you have spent any time deploying workloads on Azure, you have likely run into a frustrating wall of overlapping terminology. Log Analytics Workspaces, Azure Monitor Workspaces, Application Insights, Azure Monitor Metrics… It feels like Microsoft renamed the same service few times, or built different tools to do the exact same thing.
This deep-dive guide is here to clear up the confusion once and for all. By the end of this post, you will understand exactly what an Azure Monitor Workspace is, how it differs from a Log Analytics Workspace, how much it costs, and how to architect it without losing your sanity.
Resolving the Ultimate Naming Identity Crisis.
Let’s address the elephant in the cloud: An Azure Monitor Workspace is NOT the same thing as a Log Analytics Workspace. Historically, we sent everything to a Log Analytics Workspace. But as cloud-native architectures evolved, that model became inefficient for high-frequency, time-series metrics. To solve this, Microsoft split their storage strategies:
Log Analytics Workspace : This is your traditional, Kusto Query Language (KQL)-powered relational database. It is designed to store heavy, tabular data—like Windows Event Logs, Syslog, application traces, security events (for Microsoft Sentinel), and audit trails.
Azure Monitor Workspace : This is a specialized, ultra-high-performance time-series database. It is designed for one specific purpose: to ingest, store, and query Prometheus-compatible metrics using Prometheus Query Language (PromQL).
In short: Logs go to Log Analytics. Prometheus metrics go to Azure Monitor Workspaces.
Head-to-Head: Log Analytics vs. Azure Monitor Workspace.
If you are trying to decide where your data should go, use this quick architectural cheat sheet:

Which Azure Resources Support Azure Monitor Workspace?
Because the Azure Monitor Workspace is built specifically for the Prometheus ecosystem, it natively integrates with containerized and cloud-native systems:
Azure Kubernetes Service (AKS): Fully integrated. With a single click or a line of Terraform, Azure deploys a managed agent to scrape your cluster’s Prometheus metrics and stream them straight to your workspace.
Azure Arc-enabled Kubernetes: Extends this native integration to your Kubernetes clusters running on-premises, in AWS, or in GCP.
Azure Virtual Machines (VMs): While there isn’t a simple “one-click” toggle yet, you can run standard Prometheus exporters on your virtual machines and configure them to forward metric streams directly to the workspace.
Any External Prometheus Server: Running a self-hosted Prometheus server elsewhere? You can configure it to use remote-write to securely stream its metrics into your Azure Monitor Workspace as a highly scalable cloud backup.
The Burning Question: Do I Need to Deploy a Dedicated Prometheus Server?
No. Microsoft manages the entire pipeline for you.
Traditionally, running Prometheus meant deploying a Prometheus server, managing storage disks (Persistent Volumes), configuring scraping intervals, and handling scaling when your cluster grew.
With Azure’s managed solution:
Azure automatically installs the Azure Monitor Agent (AMA) as a lightweight daemonset in your AKS cluster.
The agent discovers your endpoints and scrapes the metrics automatically.
The agent streams that data directly to your Azure Monitor Workspace, removing the operational headache of maintaining your own metric storage nodes.
What About Costing? (The "Secret" Budget Saver)
Creating an Azure Monitor Workspace and configuring Managed Prometheus is completely free to deploy. You only pay for what you actually ingest and query:
Ingestion Cost: Approximately $0.16 per 10 million data samples written to the workspace.
Query Cost: Approximately $0.001 per 10 million data samples processed when your Grafana dashboards or alert rules run.
The Big Win: Free 18-Month Retention
In a standard Log Analytics workspace, storing data long-term gets expensive quickly. But with the Azure Monitor Workspace, Microsoft stores your Prometheus metrics for 18 months entirely for free.
For cloud teams running historical performance analysis, this retention model can cut monitoring storage bills significantly.
Architectural Best Practices & Common Pitfalls
To ensure your monitoring setup is production-ready, keep these architect-grade tips in mind:
Consolidate Your Workspaces
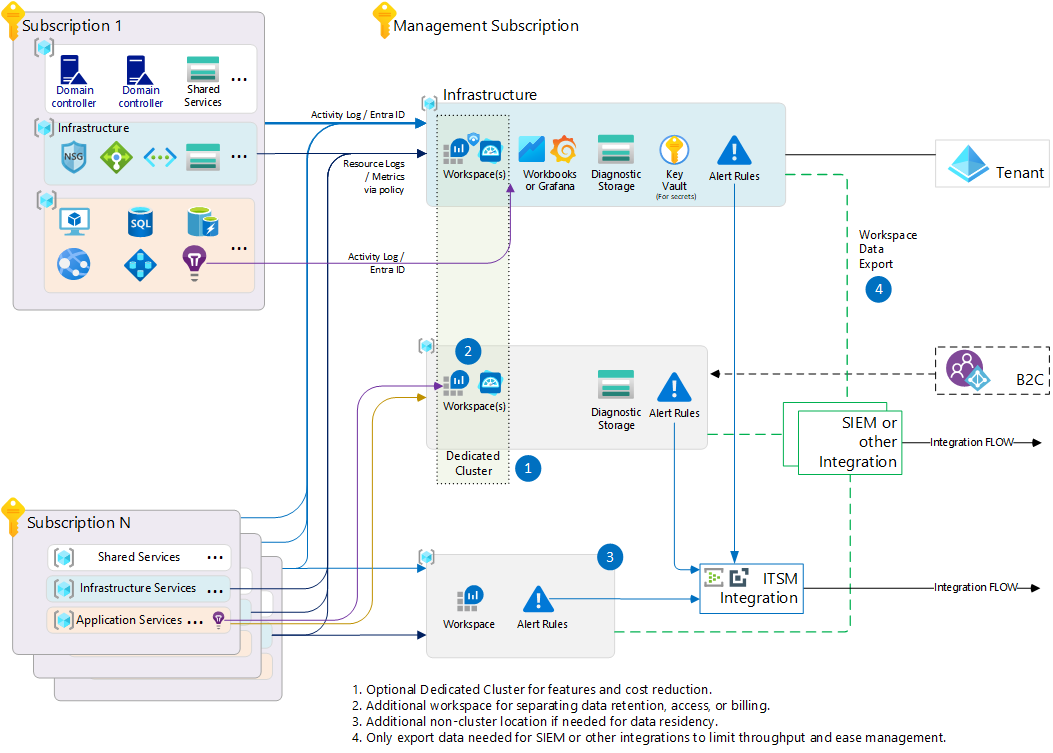
Do not spin up an Azure Monitor Workspace for every single AKS cluster. This creates fragmented dashboards and massive querying overhead. Instead, use one Azure Monitor Workspace per region/tenant to collect metrics from all regional clusters.
Summary: The Simplified Observability Blueprint
At the end of the day, modern cloud monitoring doesn’t have to be a confusing guessing game of mismatched tools. By separating your telemetry into two distinct streams, you get the absolute best of both worlds:
For System Health (The Speed Layer): Stream your container and microservice metrics directly to an Azure Monitor Workspace. It gives you the raw, lightning-fast power of Prometheus (PromQL) and Azure Managed Grafana with zero management overhead and a massive 18 months of free data retention.
For Diagnostics & Auditing (The Depth Layer): Route your virtual machine logs, firewall events, and application traces to a Log Analytics Workspace. Use KQL to hunt for bugs, perform security analysis, or feed data straight into Microsoft Sentinel.
The Golden Rule: Stop trying to force metrics into log databases, and stop trying to parse raw text logs in metric dashboards. Pair these two workspaces together, and you’ll build a highly resilient, cost-effective, and blazing-fast observability stack that your developers—and your budget—will love.